
Different ages respond to both messaging and the method of message delivery differently. Older voters rely on Facebook and YouTube, younger voters use Instagram and Snap, while the youngest use TikTok.
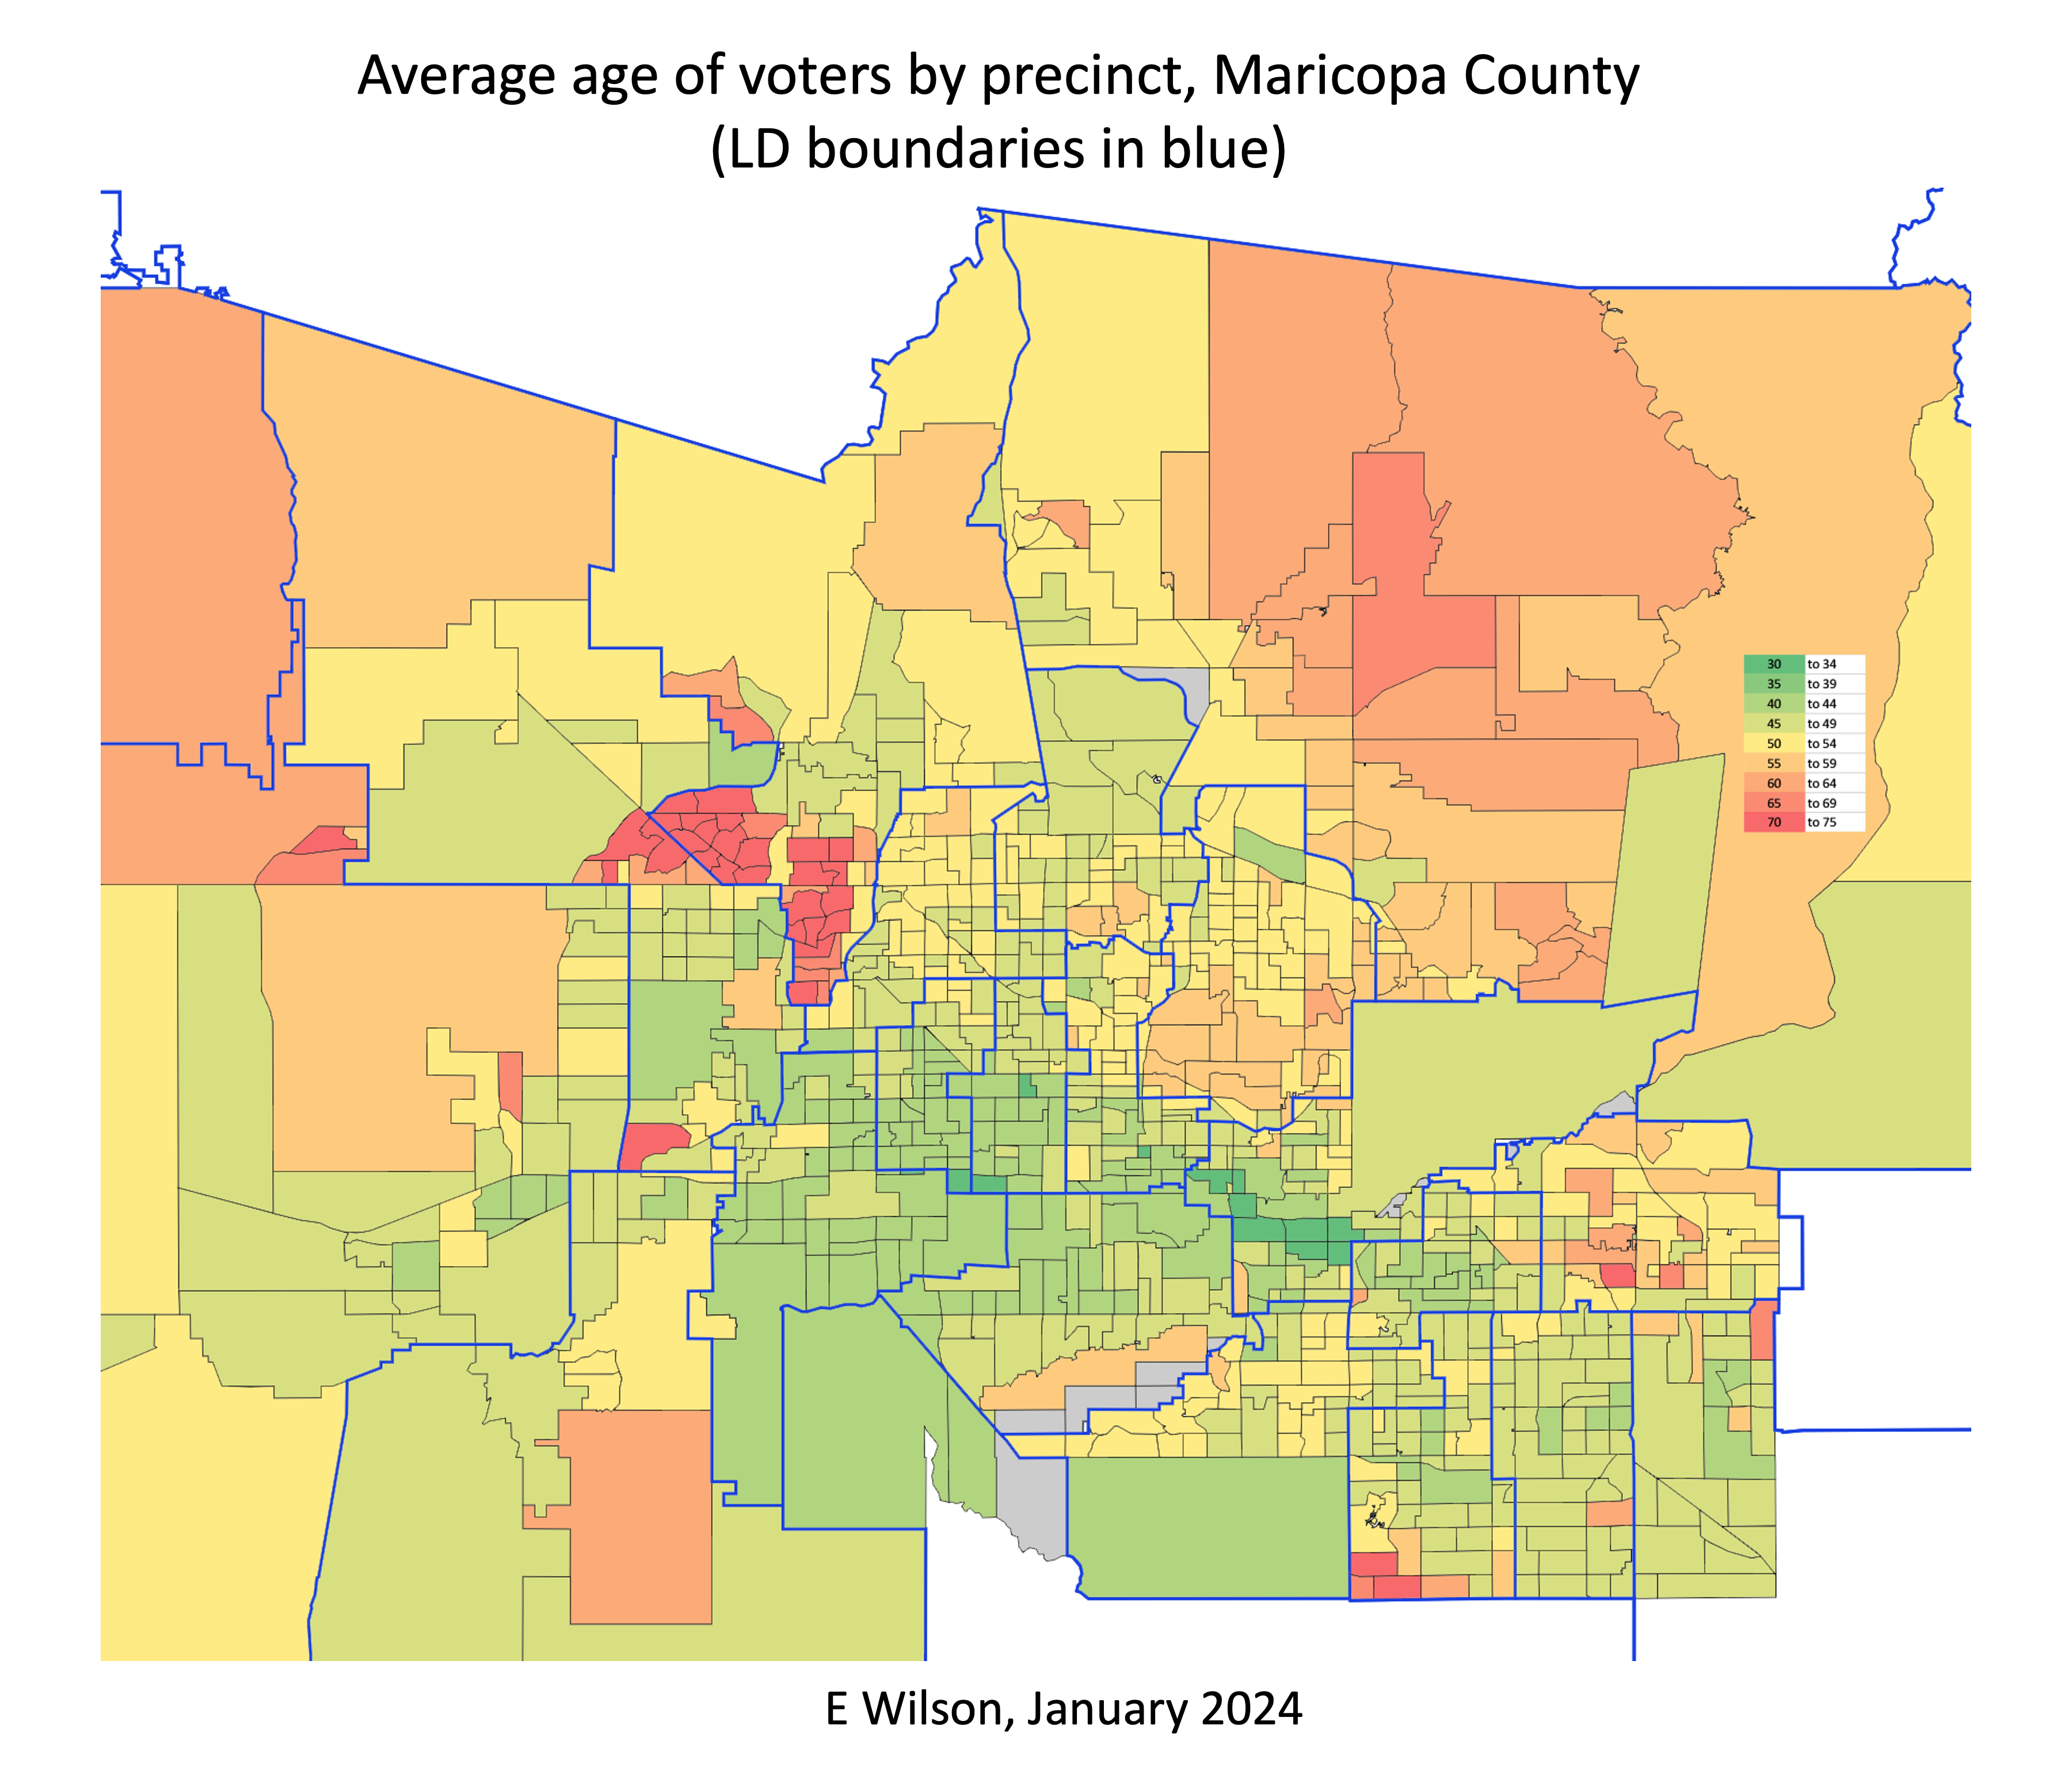
Younger voters don’t vote as consistently as older voters. It isn’t just the 20-year-olds. There is a substantial shift at age 40. The below 40 voters don’t always vote. Our Legislative Districts with the highest average age, LD28 and LD3, have extraordinarily high voter turnout. Those with the lowest average voter age have the lowest turnout. There is a direct correlation.
Here is an approximation of the average age of voters in every precinct in Maricopa County. Before you click this countywide map and zoom in to find your precinct, consider a few interesting facts about the County’s 906 precincts.

Want to look back at past Data Snacks or share with friends?
Visit the Data Snacks blog on our website!
Comments