
There are many ways we measure how well we’ve done as a voter engagement organization. There is:
who won and by how much
voter registration numbers
overall turnout
turnout trends
Dem turnout
and more…
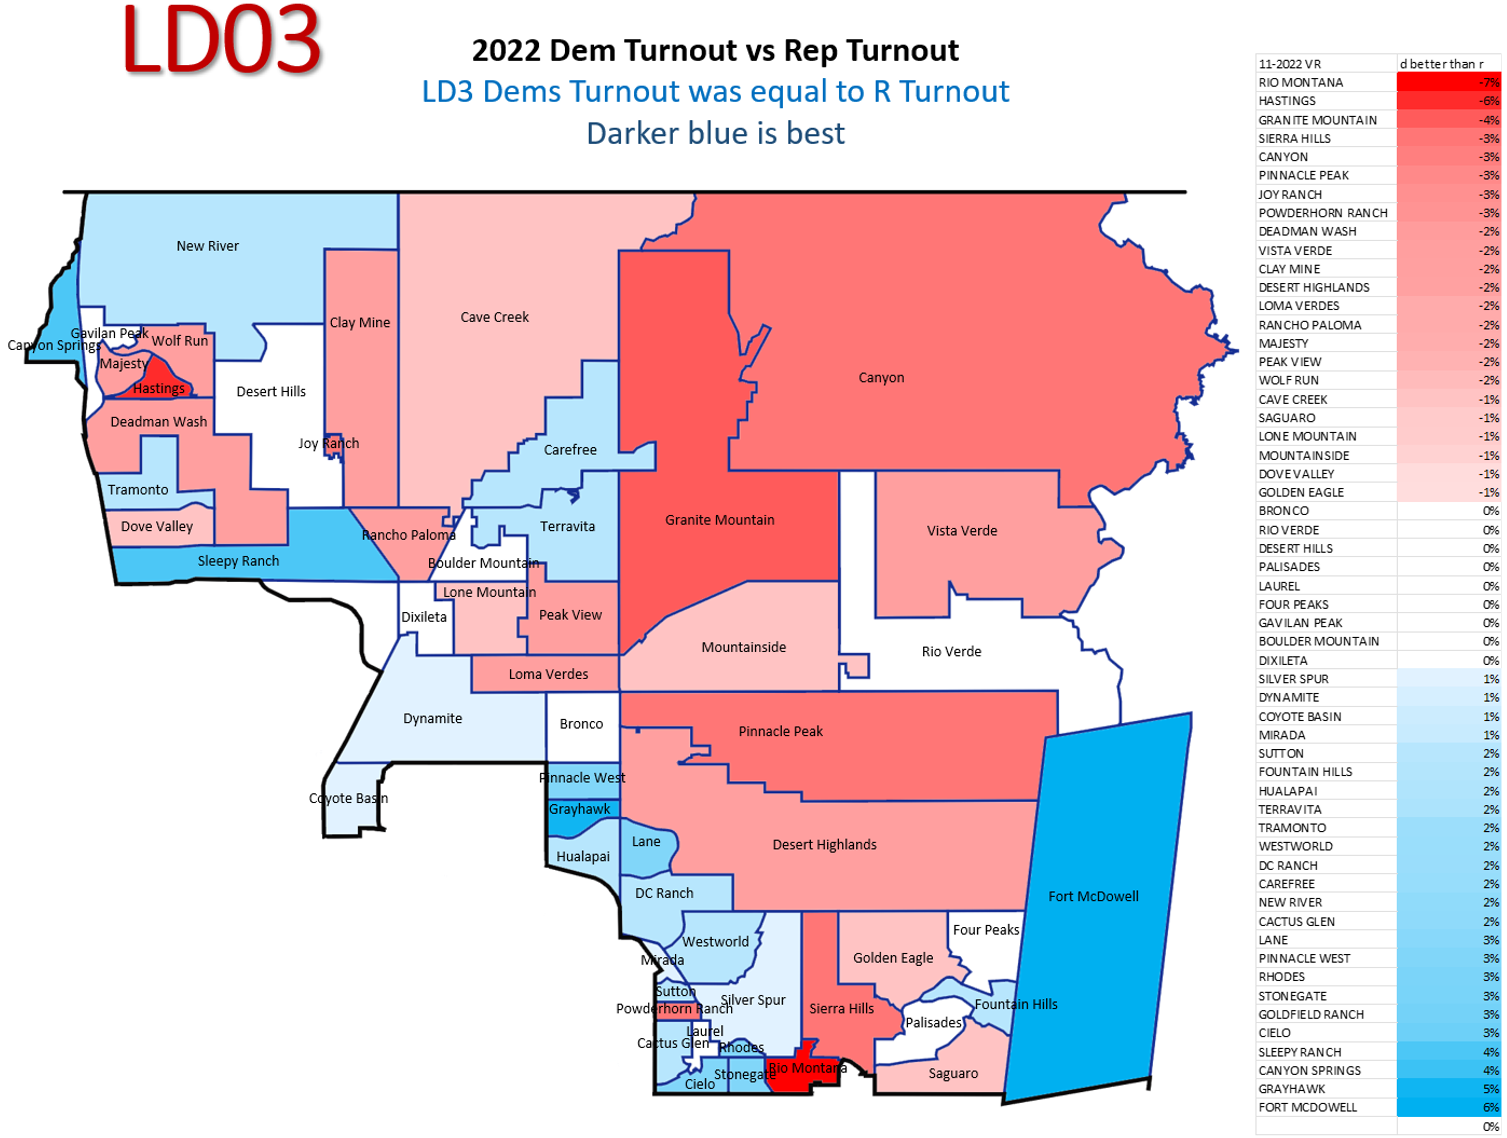
In 2022 LD3 had the highest turnout by registered Democrats in the state, 82%. We have precincts that were over 90%. Those are extraordinary results. But in some places, Republicans simply did even better.
Our district has 2.3 registered Republicans for every Democrat. Every vote we produce matters.
In LD3 Districtwide, Republicans turned out at the same rate as Democrats, 82%. For Maricopa County, Rs did 4% better. 2024 is a Presidential election year. That means every county official is on the ballot. Being 4% behind just isn’t good enough.
When analyzing other Legislative Districts there is usually a geographic or demographic pattern to help define where to concentrate on improving turnout. LD3’s far flung communities make that less obvious, but we do know where we can “up our game.” Check out your own precinct and those across LD3. Click the image below for a closer look.
Comments